A cura di Wesley Gray, Validea Capital Management
The “stock market,” at least as measured via the S&P 500, has been on an epic performance run — especially relative to almost all asset classes. It doesn’t matter whether you look at the other asset classes by geography (e.g., US, developed, emerging), style (e.g., value, momentum), or type (e.g., stocks, bonds, commodities), one thing is clear: the S&P 500 is king.
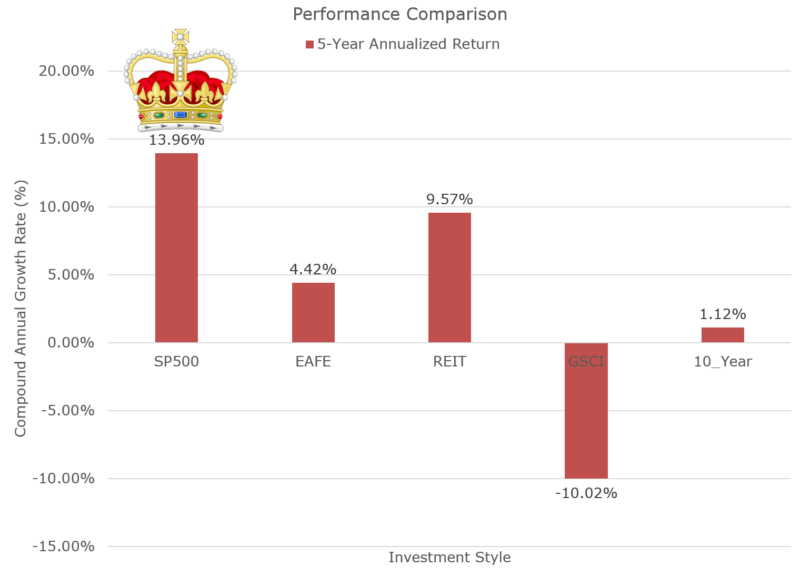
Below is a chart of the “Ivy 5,” which is a simple way to view asset classes (made popular by Meb Faber). 5-Year total return performance is from 10/1/2013 to 9/30/2018.
- US Stocks = SP500 = SP500 Total Return Index
- Int’l Stocks = EAFE = MSCI EAFE Total Return Index
- Real Estate = REIT = FTSE NAREIT All Equity REITS Total Return Index
- Commodities = GSCI = Goldman Sachs Commodity Index (GSCI) Index
- Bonds = 10-Year = Merrill Lynch 7-10 year Government Bond Index
The results are hypothetical results and are NOT an indicator of future results and do NOT represent returns that any investor actually attained. Indexes are unmanaged, do not reflect management or trading fees, and one cannot invest directly in an index. Additional information regarding the construction of these results is available upon request.
Diversification was the “loser’s game,” and investing all-in on the S&P 500 would have been your best bet.(1)
The incredible recent performance of the S&P 500, especially relative to so-called “active” strategies, has caused many market commentators to make claims that reflect partial truths:
- Factors are dead
- Value is dead
- Momentum is dead
- XYZ is dead…
The problem with all of these statements is that the S&P 500 (a.k.a., mega-cap U.S. stocks) has beaten essentially every investment style and every asset class on planet earth the past 5-years.
While these statements are correct on the surface, the implications are misleading.
In this post, by analyzing the past 5-year performance metrics of common factor strategies, we identify the following four facts for you:
- The S&P 500 gives you mega-cap beta exposure.
- Owning mega-cap stocks was the way to go over the last five years.
- Implication: Market-cap weighted looked great relative to equal-weight portfolios and/or non-mega-cap portfolios.
- Momentum (e.g., past 2-12 relative strength) is not dead.
- Implication: No indications that momentum should be abandoned.
- Value (e.g., high book-to-market) looks dead in large-caps, but hope exists for smaller stocks.
- Implication: Investors with large/mega-cap-focused value exposures may want to consider a change.
S&P 500 is a Form of Factor Investing: Large/Mega-cap Beta
Here is a plot from our visual active share tool highlighting the distribution of exposure for the S&P 500 (as measured via SPY holdings) and the total US Stock market (as measured via Vanguard VTI holdings). The X and Y-Axis reflect market capitalization. Holdings of each ETF are percentile-ranked against the universe on market cap and plotted below (100% = AAPL, AMZN, MSFT type stocks; 0% = things you’ve never heard of).
Continua a leggere su Validea Capital Management