A cura di Larry Swedroe, Validea Capital Management
There’s a large body of research, including the 2017 study “Tail Risk Mitigation with Managed Volatility Strategies” by Anna Dreyer and Stefan Hubrich, that demonstrates that, while past returns do not predict future returns, past volatility largely predicts future near-term volatility—volatility is persistent (it clusters). High (low) volatility over the recent past tends to be followed by high (low) volatility in the future. Evidence that past volatility predicts future volatility has been found not only in stocks, but also in bonds, commodities and currencies.(1)
Such evidence has led to the development of strategies that manage volatility—target a constant level of volatility rather than a constant nominal exposure—by leveraging a portfolio at times of low volatility and scaling down at times of high volatility.
Campbell R. Harvey, Edward Hoyle, Russell Korgaonkar, Sandy Rattray, Matthew Sargaison, and Otto Van Hemert, contribute to the literature on managing volatility with their study “The Impact of Volatility Targeting,” which appears in the Fall 2018 issue of The Journal of Portfolio Management. They examined the impact of volatility targeting on 60 assets, with daily data beginning as early as 1926. Their data sample ends in 2017. Using the standard deviation of daily returns to estimate volatility, they set a volatility target of 10 percent. Checking for robustness, they also tested intraday volatility measures. Their results include estimates of trading costs.
The following is a summary of their findings:
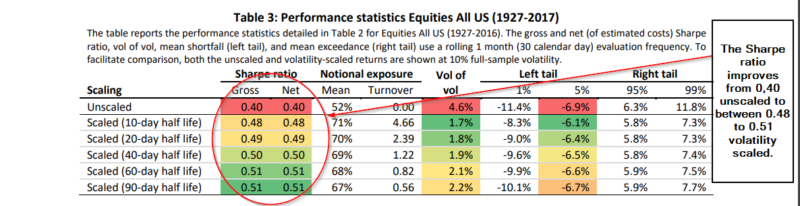
- In U.S, equities, scaling reduces volatility—the volatility of volatility is reduced from 4.6 percent for unscaled returns versus 1.8 percent for volatility-scaled returns.
- Excess kurtosis (fatter tails than in normal distributions) is reduced as volatility scaling cuts both tails, right (good tail) and left (bad tail).
- Sharpe ratios (measure of risk-adjusted return) are higher with volatility scaling for risk assets (equities and credit), as well as for portfolios that have a substantial allocation to these risk assets, such as a balanced (60 percent equity/40 percent bond) portfolio and a risk parity (equity/bond/credit/commodity) portfolio. Specifically, for U.S. equities the Sharpe ratio improves from 0.40 (unscaled) to between 0.48 and 0.51 (volatility scaled) and is not very sensitive to the choice of volatility estimate.
Continua a leggere sul Blog di Validea